Methodology
The core statistical analysis in iinuclear is handled by two main functions: rice_separation
and check_nuclear. These implement different statistical approaches to determine whether a
transient is coincident with a galaxy center.
Rice Distribution Analysis
When measuring the separation between a transient and its host galaxy center, we are effectively measuring the magnitude of a 2D vector (the offset) that has Gaussian uncertainty in each component (the location of the transient and the location of the galaxy). In this situation, even if the true separation is zero, measurement errors will always produce positive measured separations.
The Rice Distribution
The Rice distribution is a probability distribution that describes the magnitude of a vector \(R\) when its components have independent Gaussian noise. This distribution models the probability distribution of the measured separation given the true separation and the measurement uncertainty.
where:
\(r\) is the measured separation
\(\nu\) is the true separation
\(\sigma\) is the measurement uncertainty
\(I_0\) is the modified Bessel function of the first kind with order zero
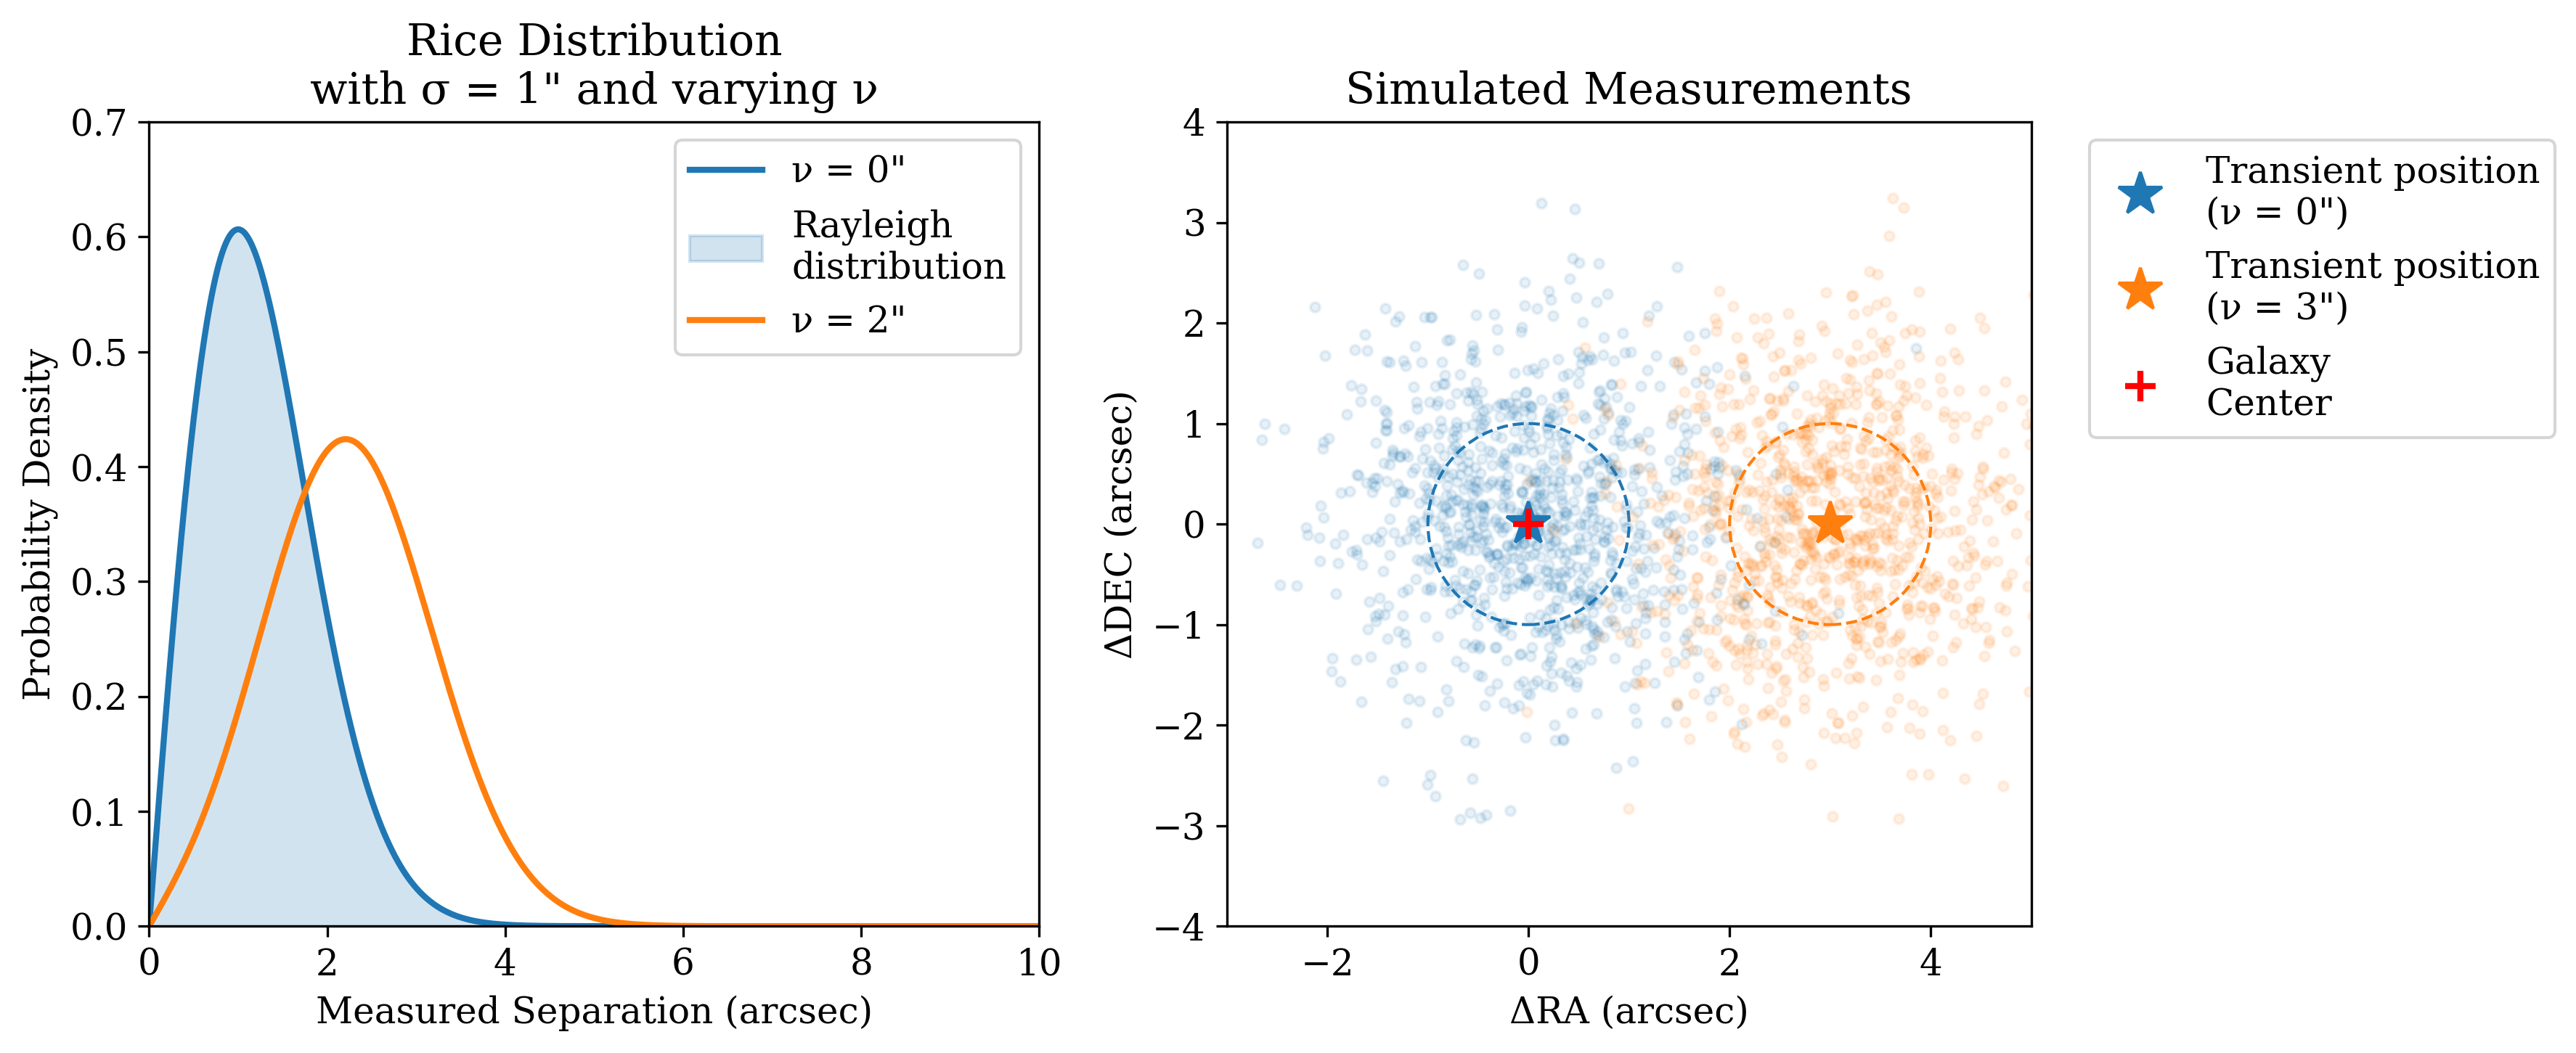
The Rice Distribution and Position Measurements. Left: The probability density function of the Rice distribution for different true separations (ν) and fixed measurement uncertainty (σ = 1”). When the true separation is zero (blue), the distribution reduces to a Rayleigh distribution, showing why measured separations are always positive even when a source is truly nuclear. As the true separation increases (orange), the distribution becomes more Gaussian-like. Right: Simulated position measurements (small points) for a nuclear source (blue) and an offset source (orange). The true positions are marked with stars, and dashed circles show the 1σ measurement uncertainty. The red cross marks the galaxy center. Even for the nuclear source (ν = 0”), measurement uncertainties create a cloud of detections with non-zero separations, following the Rayleigh distribution shown in blue in the left panel.
Maximum Likelihood Estimation
The rice_separation function finds the most likely true separation by maximizing the likelihood:
or equivalently, minimizing the negative log-likelihood:
The function returns:
The maximum likelihood estimate of the true separation
Asymmetric confidence intervals (since the distribution is non-Gaussian)
The signal-to-noise ratio (SNR = \(\nu/\sigma\))
An upper limit when the separation is not significant
For high SNR (Default of 3), the function switches to standard Gaussian statistics as the Rice distribution approaches a normal distribution in this regime.
This demonstrates why special statistical treatment is needed when determining whether a transient is truly coincident with a galaxy center. Standard Gaussian statistics would be inappropriate for analyzing the distribution of measured separations, particularly for nuclear or nearly-nuclear sources.
Nuclear Classification
The check_nuclear function determines whether a transient’s position is statistically consistent
with the galaxy center using a multivariate analysis.
Covariance Analysis
The function accounts for two sources of uncertainty:
ZTF Position Measurements:
\[\begin{split}\Sigma_{\mathrm{ZTF}} = \begin{pmatrix} \sigma_{\mathrm{RA}}^2 & \sigma_{\mathrm{RA,Dec}} \\ \sigma_{\mathrm{RA,Dec}} & \sigma_{\mathrm{Dec}}^2 \end{pmatrix}\end{split}\]Galaxy Center Uncertainty:
\[\begin{split}\Sigma_{\mathrm{gal}} = \begin{pmatrix} \sigma_{\mathrm{gal}}^2 & 0 \\ 0 & \sigma_{\mathrm{gal}}^2 \end{pmatrix}\end{split}\]
The total covariance matrix is their sum:
where N is the number of ZTF detections.
Statistical Test
The test statistic is the Mahalanobis distance, which generalizes the concept of how many “number of sigmas” the transient is away from the galaxy center, but in multiple dimensions:
where \(\mathbf{d}\) is the vector from the galaxy center to the mean ZTF position.
Under the null hypothesis (that the transient is nuclear), this statistic follows a \(\chi^2\) distribution with 2 degrees of freedom. The p-value is:
where \(F_{\chi^2}\) is the cumulative distribution function of the \(\chi^2\) distribution.
A transient is classified as nuclear if \(p > 0.05\), indicating that we cannot reject the null hypothesis at the 95% confidence level.
Interpretation
A high p-value (>0.05) suggests the position is consistent with being nuclear.
A low p-value (<0.05) suggests the position is significantly offset from the nucleus.
The square root of \(\chi^2\) indicates how many “sigmas” away from nuclear the transient is.