Usage
Basic Usage
The simplest way to use iinuclear is through the main isit function:
from iinuclear import isit

# Using an IAU name
isit("2018hyz")

# Using a ZTF name
isit("ZTF18acpdvos")

# Using coordinates (in degrees)
isit(151.711964138, 1.69279894089)
This function will produce a plot with all diagnostics to determine if the transient is nuclear.
Requirements
For iinuclear to work properly:
The transient must have detections in ZTF in Alerce.
The host galaxy must be visible in PanSTARRS.
If the input is an IAU name, the object must be in the TNS.
Core Functions
get_data
The get_data function retrieves all necessary information about a transient and its host, including:
Retrieves ZTF light curves from the ALeRCE database.
Obtains coordinates from TNS if only an IAU name is provided.
- Gets galaxy information from PanSTARRS and SDSS catalogs including:
Coordinates
Magnitudes
Galaxy size
Positional uncertainties
Downloads a PanSTARRS image with WCS information
from iinuclear.utils import get_data

ras, decs, ztf_name, iau_name, catalog_result, image_data, image_header = get_data("2018hyz")
get_galaxy_center
This function determines the center of the host galaxy:
Combines position measurements from different filters and surveys.
Includes a minimum uncertainty (default of 0.1 arcsec) to account for astrometric solution limitations.
Alternatively, if no error is given, this will be calculated from the positional uncertainties between ZTF and PanSTARRS.
Returns central coordinates and total positional uncertainty.
from iinuclear.utils import get_galaxy_center

ra_galaxy, dec_galaxy, error_arcsec = get_galaxy_center(catalog_result)
calc_separations
Calculates angular separations between transient positions and galaxy center:
from iinuclear.utils import calc_separations

separations = calc_separations(ras, decs, ra_galaxy, dec_galaxy)
check_nuclear
Determines whether a transient is nuclear based on the data from all previous functions:
from iinuclear.utils import check_nuclear

chi2_val, p_val, is_nuclear = check_nuclear(ras, decs, ra_galaxy, dec_galaxy, error_arcsec)
Calculates \(\chi^2\) statistic for position matching
Returns p-value for nuclear hypothesis (p < 0.05 is not nuclear)
Boolean flag for nuclear classification (True if p > 0.05)
Plotting Functions
plot_image
Creates a PanSTARRS image cutout with ZTF positions overlaid:
from iinuclear.plots import plot_image

plot_image(image_data, image_header, ras, decs, ra_galaxy=ra_galaxy,
          dec_galaxy=dec_galaxy, error_arcsec=error_arcsec, ax=ax)
plt.show()
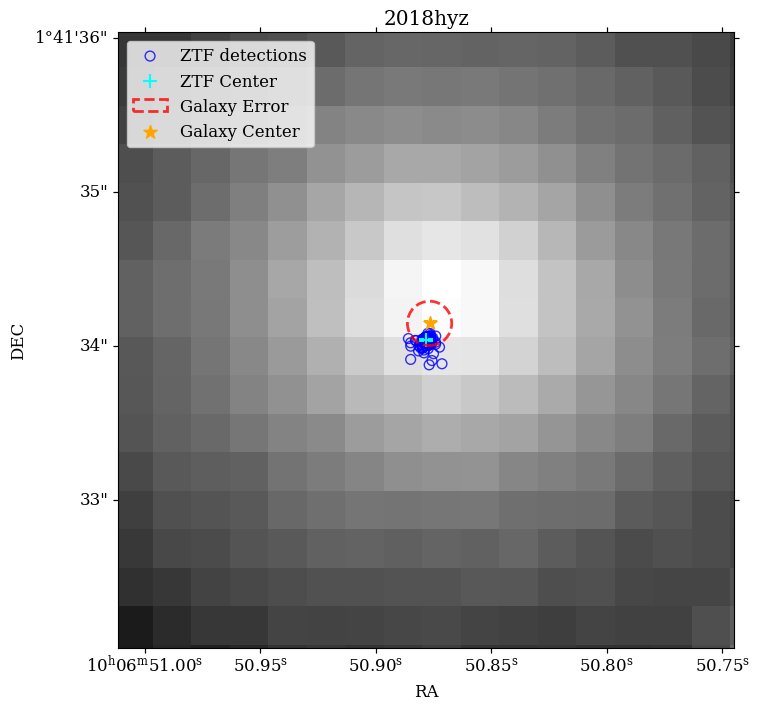
PanSTARRS image cutout showing the host galaxy with ZTF positions overlaid as blue points. The galaxy center is marked with an orange star, and the uncertainty radius is shown as a red circle.
plot_detections
Scatter plot of ZTF detections with density contours:
from iinuclear.plots import plot_detections

plot_detections(ras, decs, ra_galaxy=ra_galaxy, dec_galaxy=dec_galaxy,
               error_arcsec=error_arcsec, ax=ax)
plt.show()
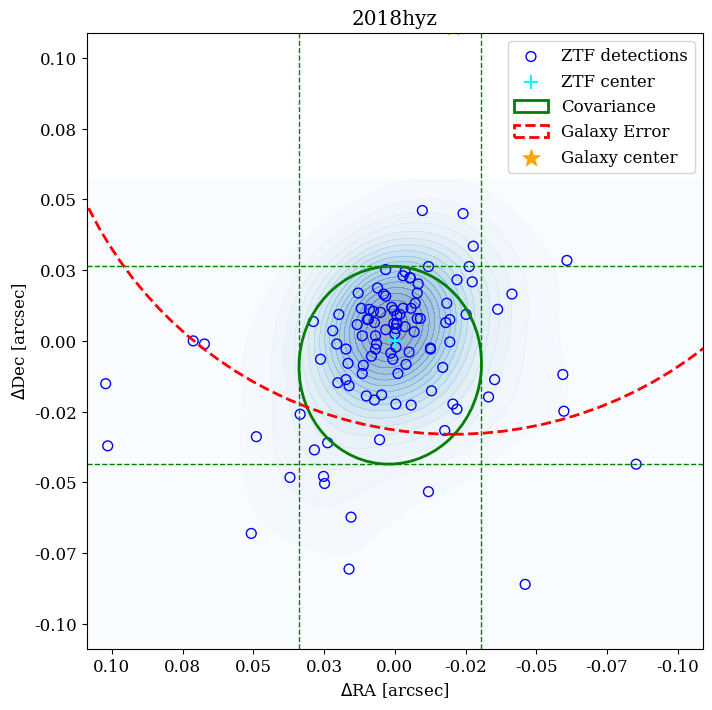
Spatial distribution of ZTF detections shown as blue points relative to the galaxy center marked as an orange star. Contours show the density of detections, and the red circle indicates the galaxy center uncertainty.
plot_histogram
Histogram of separations between ZTF positions and galaxy center:
from iinuclear.plots import plot_histogram

plot_histogram(separations, error_arcsec, ax=ax)
plt.show()
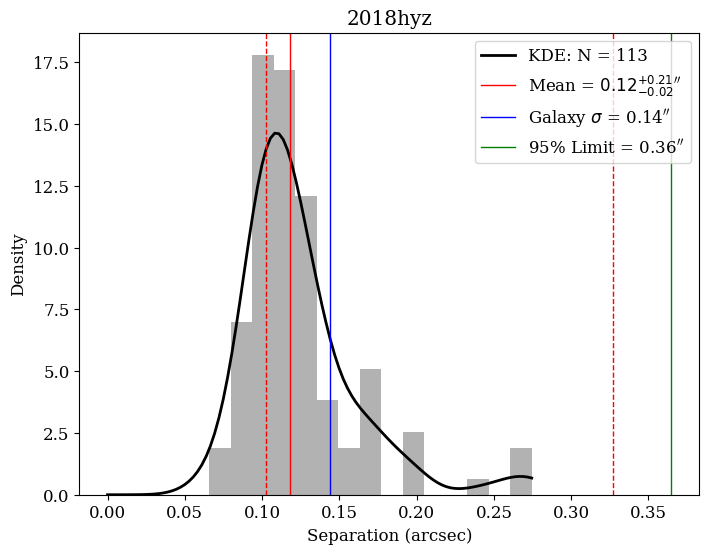
Histogram of angular separations between ZTF positions and the galaxy center. The red line shows the mean separation, with dashed lines indicating the uncertainty range. The kernel density estimate is shown in black. The 95% upper limit is marked as a green line.
plot_pvalue_curve
Shows how p-value changes with galaxy center uncertainty:
from iinuclear.plots import plot_pvalue_curve

plot_pvalue_curve(ras, decs, ra_galaxy, dec_galaxy, error_arcsec, ax=ax)
plt.show()
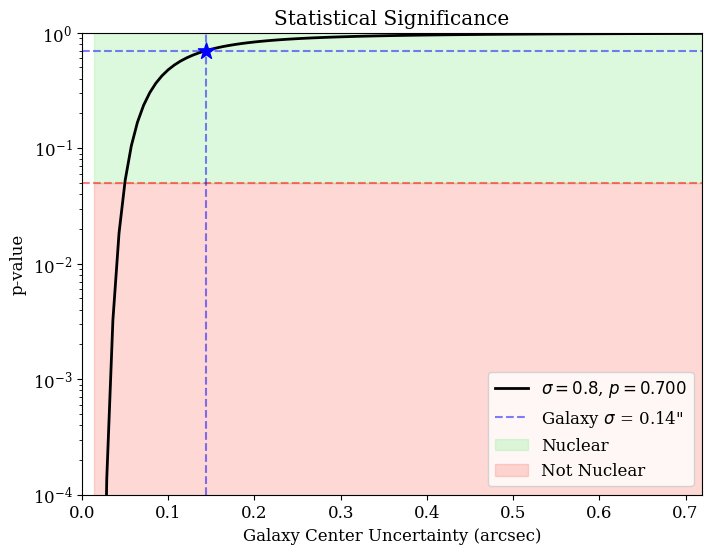
P-value as a function of galaxy center uncertainty. The blue star shows the measured uncertainty and corresponding p-value. The green shaded region indicates p > 0.05 (nuclear), while the red region indicates p < 0.05 (non-nuclear).